Friday, December 6, 2013

Happy Birthday to Me, From Me, Sorta

A few years ago, I worked at a company that uses SAS, and has a SAS server set up. I figured out that scheduling a SAS job was a bit clunky in Windows, so I mitigated the problem by setting up a SAS program run any tasks on a schedule, and then scheduling that task in Windows.

Since the program was evaluating dates and times to schedule tasks, I threw in a few happy birthday emails as a joke. A few years later, I woke up today to find this in my email inbox:
Chris,

Happy birthday! I hope you have a great day!

Sincerely,

The [Company Name] SAS Server
Well, I'm surprised that's still running! At least it wasn't sent from my old account on that server: they had at least updated who was running the job. But I'm a bit surprised they still let this go. Either they don't realize that the scheduling code contains the happy birthday emails, or they don't mind.

As a side note, the program also ran CheckLog, which reviews the SAS log output for issues, and it emailed the author about the status of the program. This was better than running CheckLog within a program, since the program could crash before it even got to the end, resulting in no status update when it was the most critical.

At any rate, it's good to  know what I wrote is still useful, even if it contains a bit of questionable code!

Tuesday, November 12, 2013

What is a Data Scientist?


Today on Quora, someone asked, "What are some software and skills that every Data Scientist should know?". I wrote the following as a response, reflecting on my current position and the role I play.


I started adding post-it notes with sub-titles to my name/title tag on my cube, as sort of a joke regarding the question, "What is a Data Scientist?".

Here's the current list:
  • [Client] Analyst
  • [Product A] Analyst
  • Financial Analyst
  • Sales Analyst
  • Contract Analyst
  • Quality Assurance Analyst
  • Call Center Analyst
  • Data Surgeon (aka, data mining with the intent to figure out what's wrong)
  • Data Diagnostician (alternative of above, maybe with no details to examine)
  • [Product B] Analyst
  • Database Developer
  • Bug Finder (as in software bugs)
So it would appear from this list that there isn't a lot of data science going on. And that's partially true.

Each of our clients has its own relational database, so we do "meta-queries" to access them one by one in order to answer a question. That's sort of data science like. Eventually, though, we're going to have one master database with all clients that will cascade into individual databases. So our "meta-queries" will be obsolete.

We deal with a lot of "big data" too, but it's usually not that big of a deal. Even with relational databases, it's okay. Some queries may take a little longer (30-60 minutes), but that's rare. We have some machine learning tasks that pull in massive training data sets, so at that point you have to be more careful about "big data" problems like running out of RAM or disk space. But it can be handled, and rather simply.

What I really wish I could do more of is machine learning, and while I've accumulated several ideas that would enhance products or help us make better decisions in the year I've been a Data Scientist, these other tasks take up most of my day.

In the end, I write a lot of SQL, use the Linux command line moderately, and report on data in Excel spreadsheets. I use Python occasionally to write scripts. And I'm always learning something new (new SQL techniques, Python libraries, Linux command line tools, etc.).

Friday, August 23, 2013

Redundant SQL

Today I wrote some SQL that, when spoke, sounded like "select client from client as client", written:

select  (select client from client) as client ...

Then I thought, could I actually write something even more ridiculous? What about "select select as as from from", and so I came up with:

create table "from" as select 'select' as "select" from dummy;
select "select" as "as" from "from";


The result is a one-cell table:

as
------
select

The table "dummy" is an empty table, used for "selecting" from something not actually in any table. The double quotes make the SQL execute even though it is using special keywords.

I tried adding a "group by group" and an "order by order", but that didn't work as I would have thought. I guess I can take this silliness only so far.

Sunday, March 17, 2013

Lego Raspberry Pi Cases

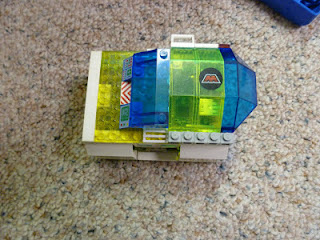
I purchased a Raspberry Pi last year, and inspired by a girl in Britain who assembled her own Pi case, I spent way too much time making my own Lego case:


I made it so it could be mounted on the wall. Additionally, the left side opens to expose the GPIO pins, although I doubt you could fit something on them without having to remove pieces from the case.


A friend of mine also has a Pi, but he was using a plastic food container for its housing. I simply could not stand for this, so I created another case for him:


This one doesn't mount on the wall. I think he's just using it on an entertainment center near the cable modem box. Unlike my case, it opens fully, exposing the entire board. I forgot to take a picture of this feature, but you can see the hinges on one of the side photos.

Both of these cases use some classic Lego pieces that I received from my cousin when I was a kid. The old-school computer terminals in blue and grey and the pieces with space logos came from this set, and I mixed them with some newer space buttons and circuitry. The glass-like covers are also newer, but have a similar hokey space feel to them.

It was fun putting my old Legos to use again!

Wednesday, February 6, 2013

My Professional Network, Graphically

A few months ago, I was thinking about my professional network and wondered what it would look like if it were mapped out. It turns out, LinkedIn has a lab project to do just that. I loaded up my profile and a few minutes later, this came out (click for larger version):


Each dot in the above chart represents a person, and each line represents a connection between people. The larger the dot, the closer the relationship. I am at the center, and unique clusters of people become apparent by their interrelationships, and they are grouped together in space.

The lab does not label the clusters, but it does identify the clusters by color, and it allows the user to identify those clusters and name them, as I have done above. Further, you can explore your network by hovering over the individual dots that represent people.

Essentially, five groups arise from my network: Family, Friends, and Educators on the left; Dean Health Plan at the top; CPM Healthgrades at the upper right; the UW Health System, which is composed of the University of Wisconsin Medical Foundation (UWMF), the University of Wisconsin Hospitals and Clinics (UWHC), and the University of Wisconsin School of Medicine and Public Health (UWSMPH); and finally the SAS Institute at the bottom.

The lab isn't perfectly accurate, but it is pretty good. I checked out a number of individuals and some don't make sense, but most do. As an example, my wife is one of the larger dots on the left, which makes sense, since she also has networked with our friends and family on LinkedIn (although I usually avoid doing so for a number of reasons).

The UW Health cluster is visually split, but there is apparent movement and interrelationship between the organizations. There are some people who traveled between the UW and Dean, one way or another. The same is true between Dean and CPM, with most, I believe coming from Dean to CPM. There are some hubs in each organization, likely managers, project managers, or other people who attended a lot of meetings (I think one of the big dots at Dean was an IT manager who sat in on a lot of projects).

Aside from family and friends, SAS is probably the oddest group. I have some connections, and they seem to be somewhat strong. Before I attended the SAS Global Forum, this chart may have looked quite different, since I made many more connections after the conference. The chart also shows how well-developed my connections were at Dean and the UW, and how I'm still fairly new at CPM. (I bet if I ran this today it would look a bit better developed.)

Of course, charts like these leave out people who aren't on such sites as LinkedIn, but I would think that all the other people would compensate for them when graphed like this. Additionally, I don't have much of a network for old jobs like the ones I had in college, nor have I really networked much with fellow college classmates.

It would be interesting to see what other people's networks look like, especially people who are essentially professional networkers, like HR professionals or recruiters. How do networks in different industries look (mine is mostly health care)? What if you have someone who only networks with family or friends? What does that show? Perhaps different geographic locations you've lived in? How about someone who is a world traveler?

This type of graph is very powerful in that makes you think about the data behind it and ask such questions as I have done. It opens up doors we haven't thought of and inspires curiosity.